
Math
Free Printable Addition Chart (0 to 10 and 0 to 12)
Filled and blank addition charts with answer keys, a subtraction chart, how to read an addition table, what its patterns show, and how to use one at home.
Grades: kindergarten to grade 2 · Common Core: 1.OA.C.6, 2.OA.B.2 · Texas: 2.4(A) · Related: Common Core 1.OA.B.3, 1.OA.B.4; Texas 1.3(D), 1.5(G)
An addition chart, also called an addition table, holds every sum from 0 + 0 to 10 + 10 (or to 12 + 12) in one grid. Find one number down the left side and the other across the top, and the square where they meet holds the sum: the 8 row meets the 5 column at 13. Children use it from kindergarten to second grade, the years in which the Common Core expects them to learn these facts.
Each pattern on an addition chart is a strategy, so the chart is more than a place to look a fact up: a blank one shows which facts a child already knows and which are left. Free filled and blank addition charts, with a 0–10 subtraction chart, are just below. How the facts get from counting to knowing is the subject of math facts.
Free addition chart, blank addition chart, and subtraction chart
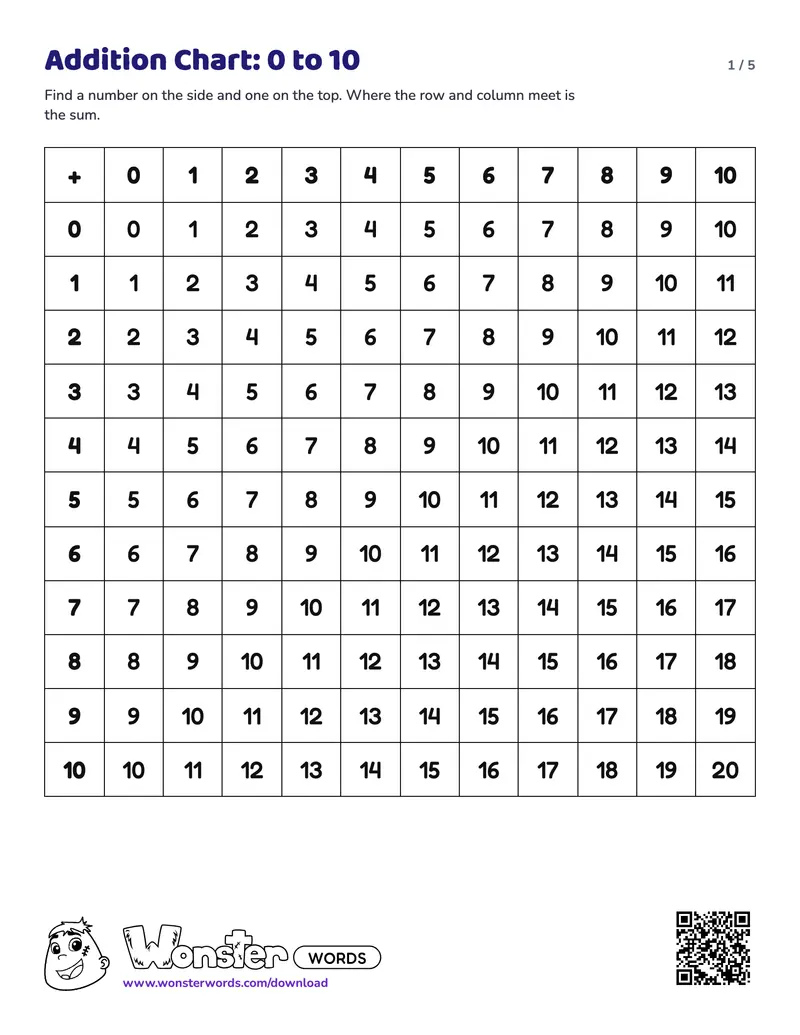
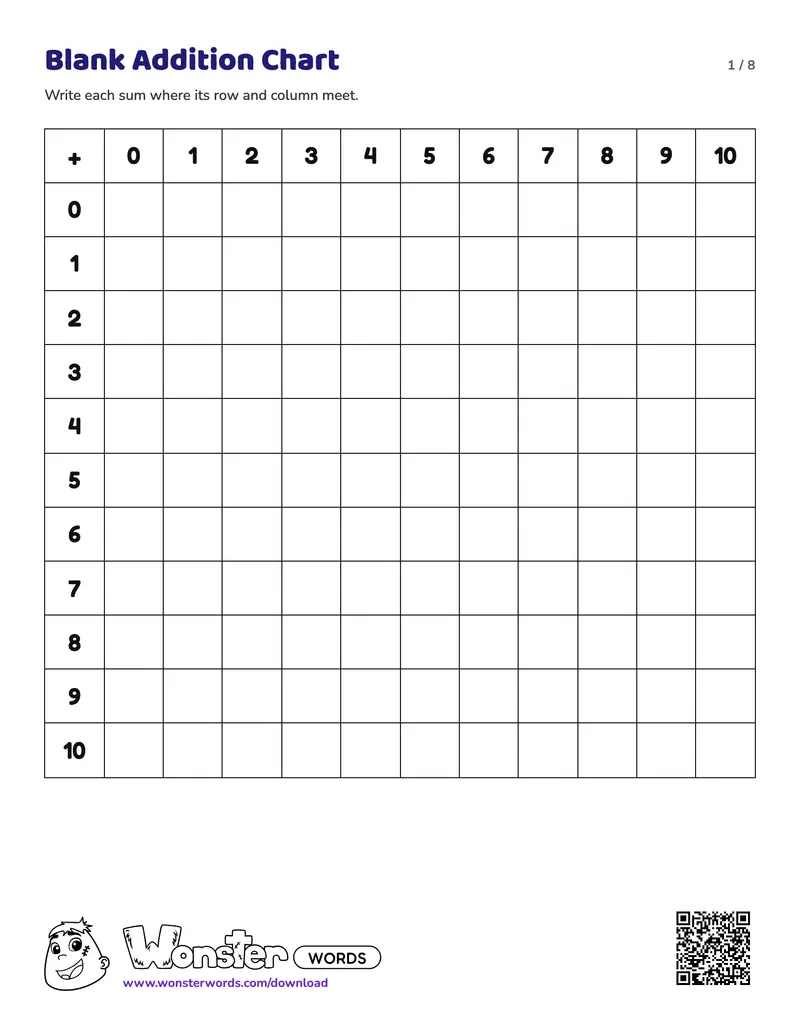
Our free addition charts come as two PDFs: an addition chart to look facts up, and a blank chart to fill in.
- Addition Chart, 5 pages, kindergarten to second grade. Filled 0–10 and 0–12 charts, the 0–10 chart with the doubles and the pairs that make 10 marked, and a 0–10 subtraction chart. Print it for the fridge and for checking answers.
- Blank Addition Chart, 8 pages, first and second grade. A blank 0–10 chart, the 26 facts that are left once every strategy fact is filled in, two pages of missing numbers, and three answer key pages.
Our charts mark the patterns with outlines rather than color, so they print on any printer, and a child who wants color can color each family in. Every PDF ends with a page for grown-ups on how to use it. Below the two charts are the addition and subtraction flash cards from our addition and subtraction facts page, sorted by the same strategy families.
Free PDF · no sign-up
Free printable addition charts
Two free PDFs in black and white, with no account and no email: the addition chart, with a 0 to 10 subtraction chart, and the blank addition chart. Every PDF ends with a page of instructions for grown-ups on why, what for, and how to use it. Below them are the addition and subtraction flash cards from our addition and subtraction facts page.
- Addition Chart (PDF)477 facts · 5 pages
Preview page 1Preview
- Blank Addition Chart (PDF)227 facts · answer key included · 8 pages
Preview page 1Preview
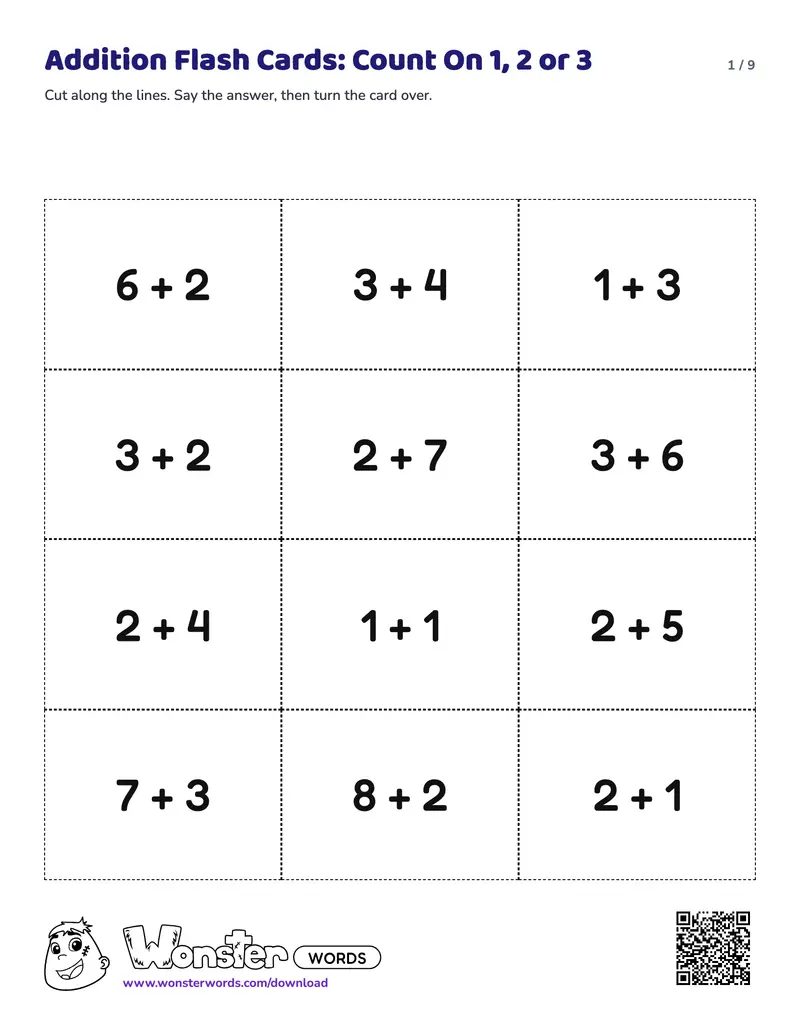
- Addition Flash Cards (PDF)45 cards · answer key included · 9 pages
Preview page 1Preview
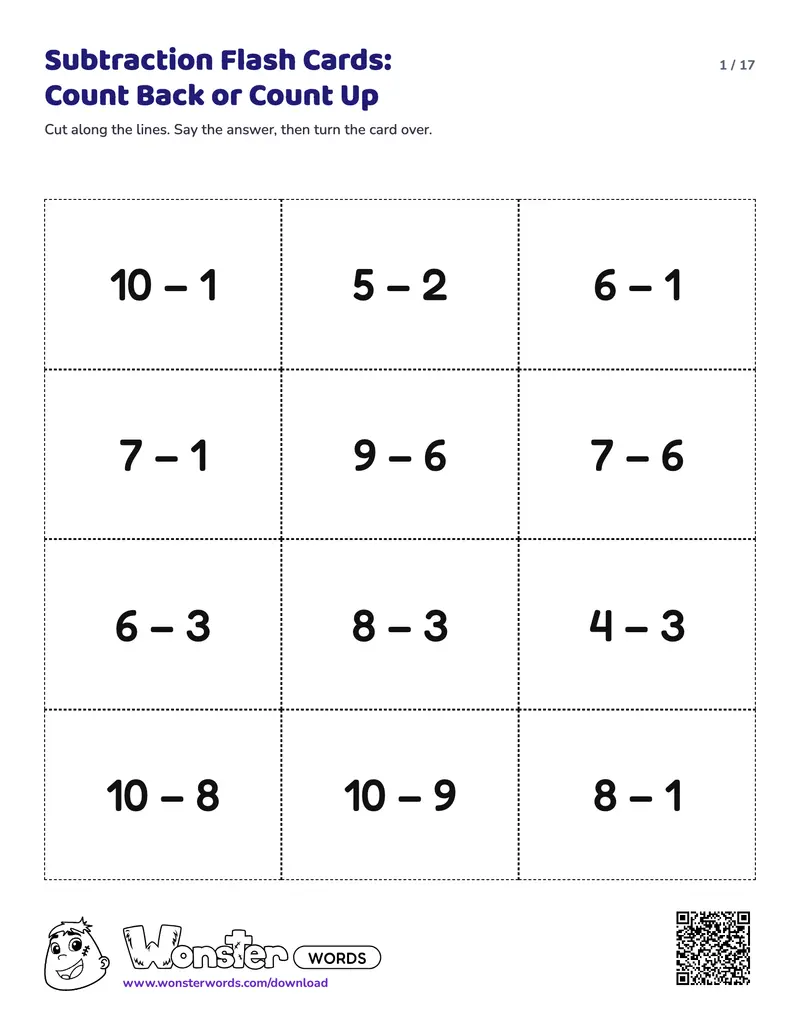
- Subtraction Flash Cards (PDF)81 cards · answer key included · 17 pages
Preview page 1Preview
How do you read an addition chart?
An addition chart, also called an addition table, is a grid with the numbers 0 to 10 (or 0 to 12) down the left side and across the top, and every sum written where a row and a column meet. To read it, find one number down the left and the other across the top. For 8 + 5, go along the 8 row to the 5 column, and the square holds 13.
The 8 row meets the 5 column at 13, so 8 + 5 = 13. The heavy outlines are the doubles, and the dashed outlines are the pairs that make 10.
What patterns does an addition chart show?
Each pattern on an addition chart is a strategy, which is the reason to print one:
- The 0 row repeats the top numbers, because adding 0 changes nothing.
- The 1 row counts on, one more in each square.
- The doubles run down the diagonal from the top left corner: 0, 2, 4, and on to 20.
- The pairs that make 10 sit on a line running the other way.
- The two halves on either side of the doubles match, because 8 + 5 and 5 + 8 have the same sum. These turnaround facts halve what there is to learn.
The patterns cut the number of facts a child has to memorize. First-grade standard 1.OA.B.3 says “If 8 + 3 = 11 is known, then 3 + 8 = 11 is also known”, which takes the 100 addition facts to 55. On a 0–10 addition chart of 121 facts, a strategy covers all but 26: adding 0, 1, or 2, the doubles, the near doubles, the pairs that make 10, and adding 10. The 26 left are 13 turnaround pairs, such as 8 + 5 and 7 + 9, and 11 of those pairs cross 10, which is where making ten works. Each strategy is taught step by step in doubles, near doubles, and make ten, and the addition strategies in the order kids learn them sets out the full sequence.
How do you use an addition chart for subtraction?
An addition chart works for subtraction too. To find 13 − 5, go to the 5 row, along it to 13, and up to the top of that column: 8. That is subtraction as a missing part, 5 plus what makes 13. Always start in the row of the number taken away, because starting in the 8 row finds 13 − 8 = 5 instead.
A subtraction chart shows the same facts directly, with the start number across the top and the number taken away down the side. Our Addition Chart PDF also has a 0–10 subtraction chart. First-grade standard 1.OA.B.4 frames subtraction the chart’s way: “Understand subtraction as an unknown-addend problem.” How children learn their subtraction facts through the addition ones is in how kids learn subtraction facts.
How to use an addition chart at home
- Explain it with the 1 row first, as counting on, then the doubles. Let your child find a fact they know before using the chart for one they do not.
- Tick the facts your child knows on a blank chart. The empty squares are what is left to learn.
- Let your child check their own answers on the filled chart.
- Fill the blank chart a row at a time, looking for each row’s pattern.
- Cover a row once it comes quickly, so the chart stops being a crutch.
The facts left on the blank chart are the ones to practice, a few at a time, and how to practice math facts at home sets out a few minutes a day with flash cards sorted by the same families.
What age is an addition chart for?
An addition chart holds the facts children learn from kindergarten to the end of second grade. Under the Common Core, first graders use strategies within 20, such as counting on and making ten (1.OA.C.6), and by the end of second grade they are expected to know all the sums of two one-digit numbers from memory (2.OA.B.2). Texas second graders “recall basic facts to add and subtract within 20 with automaticity” (2.4(A)).
The filled chart suits any child from kindergarten to second grade, as a reference and a self-check. The blank chart and its facts that are left suit first and second grade, once a child can work facts out with a strategy. The grade by grade expectations are in when kids should know their addition and subtraction facts.
Frequently asked questions
What is an addition chart and how is it used?
An addition chart, also called an addition table, is a grid with the numbers 0 to 10 (or 0 to 12) down the left side and across the top, and every sum written where a row and a column meet. To read it, find one number down the left and the other across the top. Children use it to check their own answers, and a blank chart shows which facts are left to learn.
How do I explain an addition chart to a child?
Explain it with the 1 row first, as counting on, one more in each square, then the doubles on the diagonal. Let your child find a fact they know before using the chart for one they do not. For 8 + 5, go along the 8 row to the 5 column, and the square holds 13.
Can addition charts also assist in teaching subtraction concepts?
Yes. To find 13 − 5 on an addition chart, go to the 5 row, along it to 13, and up to the top of that column, which is 8. That is subtraction as a missing part, 5 plus what makes 13. A subtraction chart shows the same facts directly, with the start number across the top and the number taken away down the side.
What is the quickest way to learn an addition table?
Learn the strategies first, then practice what is left. Turnaround facts halve the table, since 8 + 5 and 5 + 8 have the same sum. On a 0 to 10 table of 121 facts, adding 0, 1, or 2, the doubles, the near doubles, the pairs that make 10, and adding 10 cover all but 26. Practice those 26 a few at a time.
How long does it typically take to memorize the addition table?
About three school years, from kindergarten to the end of second grade, which is the span the Common Core gives the facts within 20. Children learn them one strategy family at a time, counting on, then doubles and near doubles, then making ten. A first grader who still works some facts out is on schedule.
Related guides
Last updated